Contents
- Part I - Bone Structure and Composition
- Part II - Biomechanics of Bone
- Part III - Mechanism of Injury and Fracture Patterns
- Part IV - Open versus Closed Fractures and the Soft-Tissue Envelope
- Part V - Fracture Classification
- References
Part I - Bone Structure and Composition
A fracture is a structural failure of bone, so understanding it begins with the material itself. Bone is a living composite of cells, water and extracellular matrix. By weight it is roughly 60-70% mineral (calcium hydroxyapatite), 20-25% organic matrix, and the remainder water.[1] The two phases divide the mechanical labour. The mineral provides stiffness and compressive strength, while the organic matrix (90% type I collagen) provides tensile strength and toughness (energy absorption).[2]
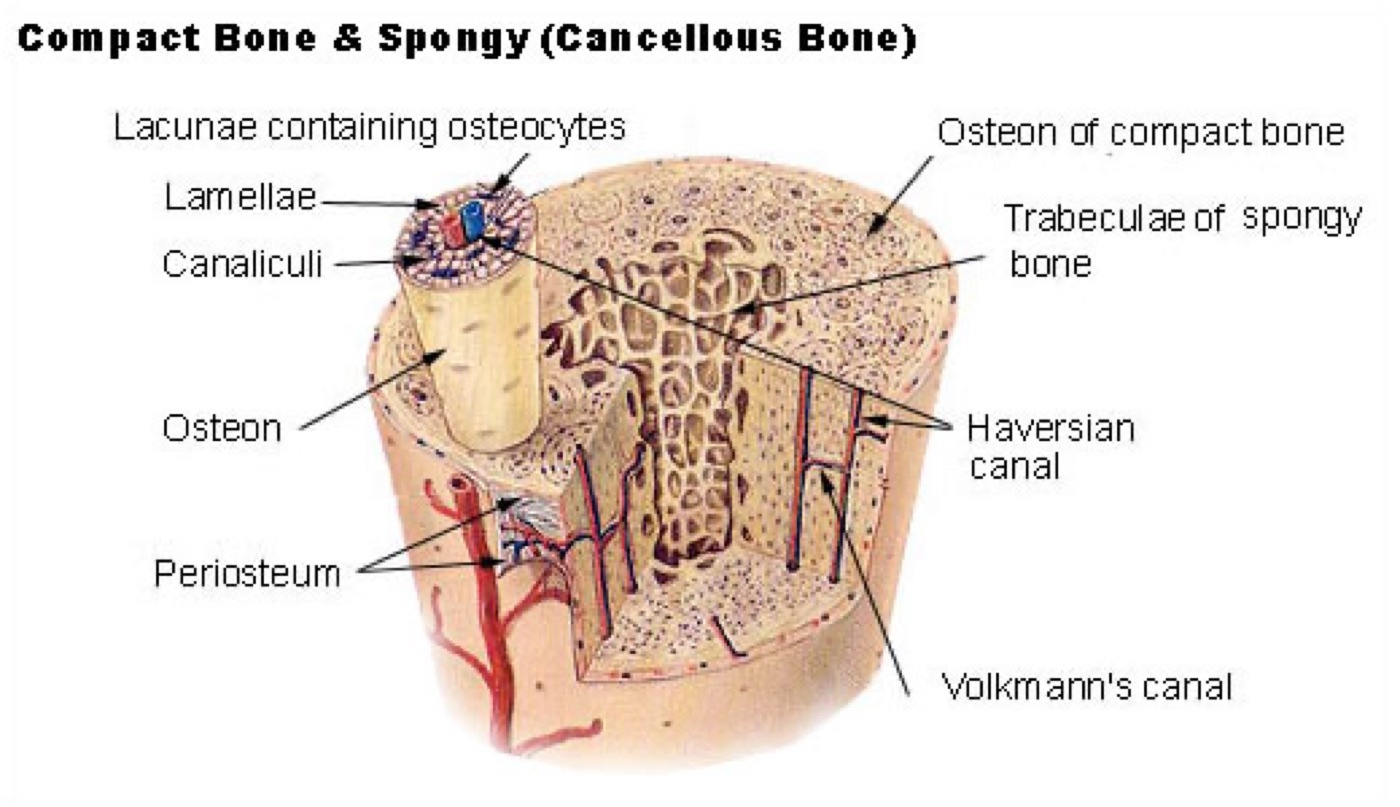
Figure 1. Microstructure of compact (cortical) and spongy (cancellous) bone: osteons/Haversian systems, lamellae, and trabeculae. Source: SEER (NCI SEER Training Modules), via Wikimedia Commons, public domain.
Figure 1. Microstructure of compact (cortical) and spongy (cancellous) bone: osteons/Haversian systems, lamellae, and trabeculae. Source: SEER (NCI SEER Training Modules), via Wikimedia Commons, public domain.
At the microscopic level bone is either lamellar (the mature, organised bone of both cortex and cancellous bone, its collagen oriented along the lines of stress) or woven (immature or rapidly formed bone, as in fracture callus, with randomly oriented collagen that is weaker and more flexible). Remodelling converts woven to lamellar bone.[3] Structurally, cortical (compact) bone is dense, built of concentric lamellae wrapped around a central canal as the osteon (Haversian system), with a density of about 1.8 g/cm³. Cancellous (trabecular) bone is porous (typically 70-80%, density 0.1-1.0 g/cm³) and far weaker at the structural level, even though the individual trabecular material is only slightly less stiff than cortical bone.[4]
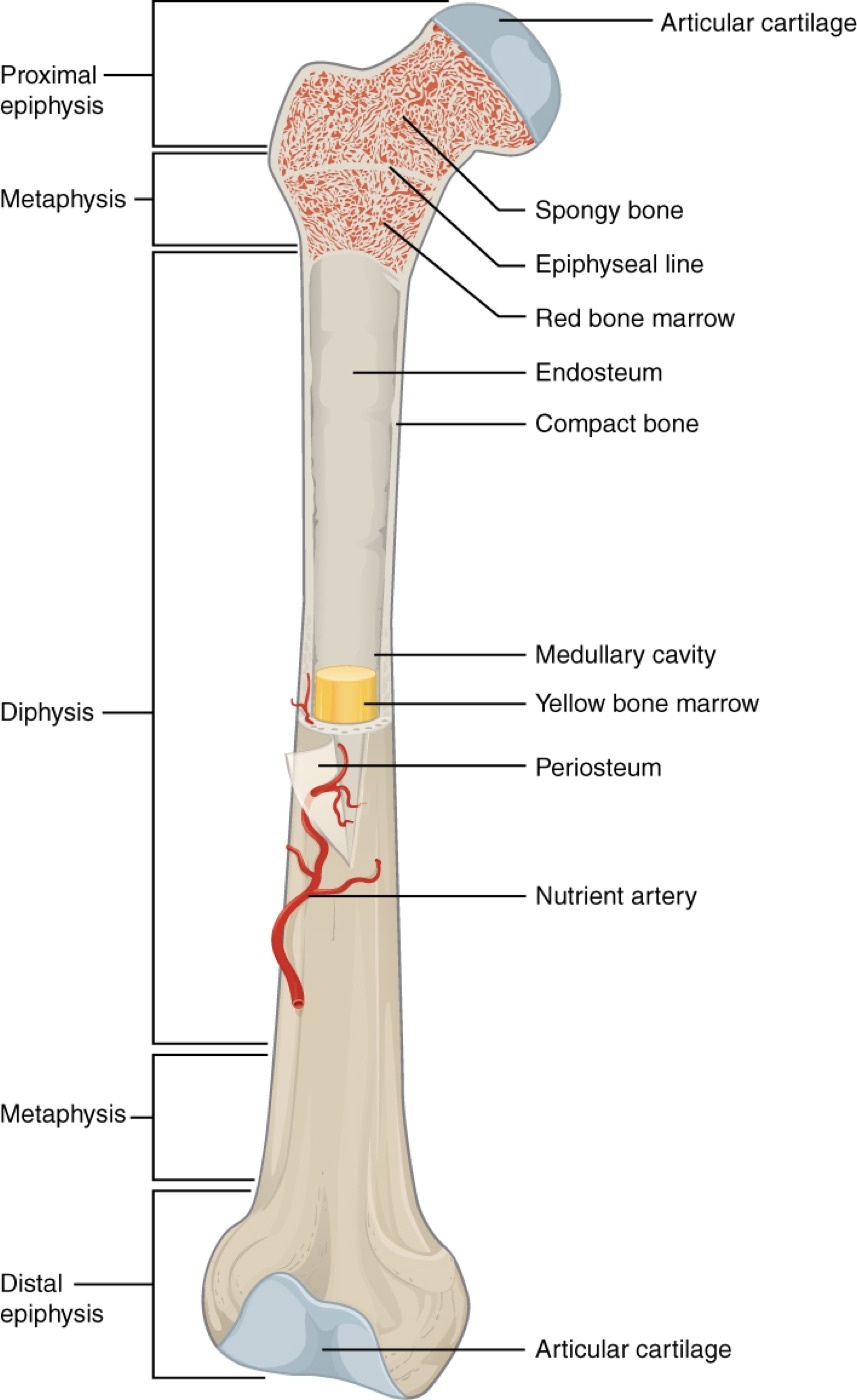
Figure 2. Anatomy of a long bone: diaphysis, metaphysis and epiphysis, with cortical and cancellous bone, periosteum and medullary cavity. Source: OpenStax College, Anatomy & Physiology, via Wikimedia Commons, CC BY 3.0.
Figure 2. Anatomy of a long bone: diaphysis, metaphysis and epiphysis, with cortical and cancellous bone, periosteum and medullary cavity. Source: OpenStax College, Anatomy & Physiology, via Wikimedia Commons, CC BY 3.0.
Part II - Biomechanics of Bone
The vocabulary of mechanics
Stress (σ = force ÷ area, in pascals) and strain (ε = change in length ÷ original length, dimensionless) describe the load on a material and its deformation. Plotting one against the other gives the stress-strain curve, whose landmarks are the elastic region (deformation fully recovers), the yield point (where permanent/plastic deformation begins), and the ultimate strength (where the material fails).[5] From this curve come the key properties:
- Young’s (elastic) modulus (E = σ/ε) is the slope of the elastic region, a measure of stiffness.[6]
- Strength is the load required to cause failure. Stiffness and strength are distinct: titanium is far less stiff than steel yet of similar ultimate strength.[7]
- Toughness is the area under the curve, i.e. the energy needed to break the material.[8]
- Ductile versus brittle: a ductile material (steel) deforms greatly before failing, whereas a brittle material (PMMA, and to a degree bone, which “behaves more like glass than rubber”) fails with little deformation, its yield point near its failure point.[9]
There is an important distinction between material and structural properties: the stress-strain curve and modulus define the material, whereas the structure’s behaviour depends also on geometry. Bending stiffness rises with the second moment of inertia. For a cylinder it scales with the fourth power of diameter, so doubling a bone’s diameter increases its bending stiffness roughly sixteen-fold, and placing material far from the centre (the hollow diaphysis, the I-beam) is highly weight-efficient.[10]
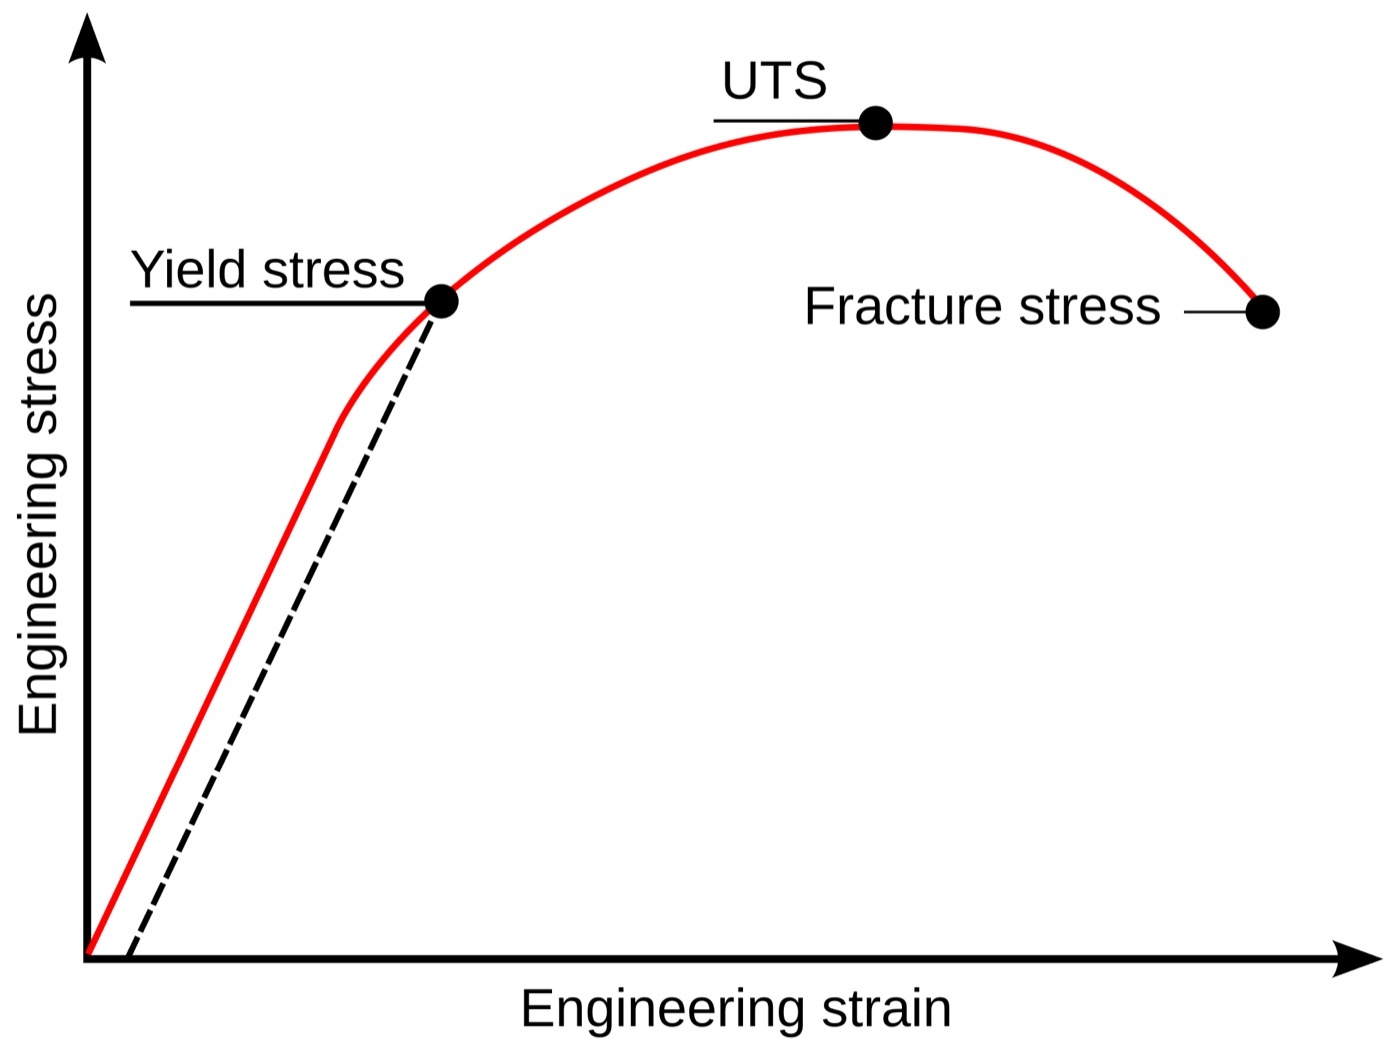
Figure 3. Stress-strain curve: the linear elastic region, the yield point (onset of plastic deformation), the ultimate strength, and fracture. The area under the curve is the toughness. Source: Sigmund, via Wikimedia Commons, public domain.
Figure 3. Stress-strain curve: the linear elastic region, the yield point (onset of plastic deformation), the ultimate strength, and fracture. The area under the curve is the toughness. Source: Sigmund, via Wikimedia Commons, public domain.
What makes bone special
Bone is not a simple elastic solid. It is viscoelastic (strain-rate dependent): loaded rapidly, its modulus rises up to twofold, making it stiffer, stronger and able to store more energy before it fails.[11] It is anisotropic, meaning its properties depend on direction, so it is strongest in compression, weaker in tension, and weakest in shear, and stronger loaded longitudinally (along the osteons) than transversely (longitudinal modulus ~17 GPa versus ~12 GPa transverse).[12] It is also remarkably fatigue-resistant. Repetitive sub-failure loading creates microcracks, but unlike an inert implant, in which microcracks accumulate until fatigue failure, living bone continuously repairs them by osteoclast-mediated remodelling. A stress (fatigue) fracture results when loading outpaces this repair, classically in a military recruit or athlete who suddenly increases activity.[13] Finally, bone adapts its mass and architecture to the loads it carries (Wolff’s law / functional adaptation), the principle that also underlies stress shielding around stiff implants.[14]
Part III - Mechanism of Injury and Fracture Patterns
The single most useful clinical inference is that the fracture pattern reveals the loading mode, while the severity (comminution) reflects the energy.[15]
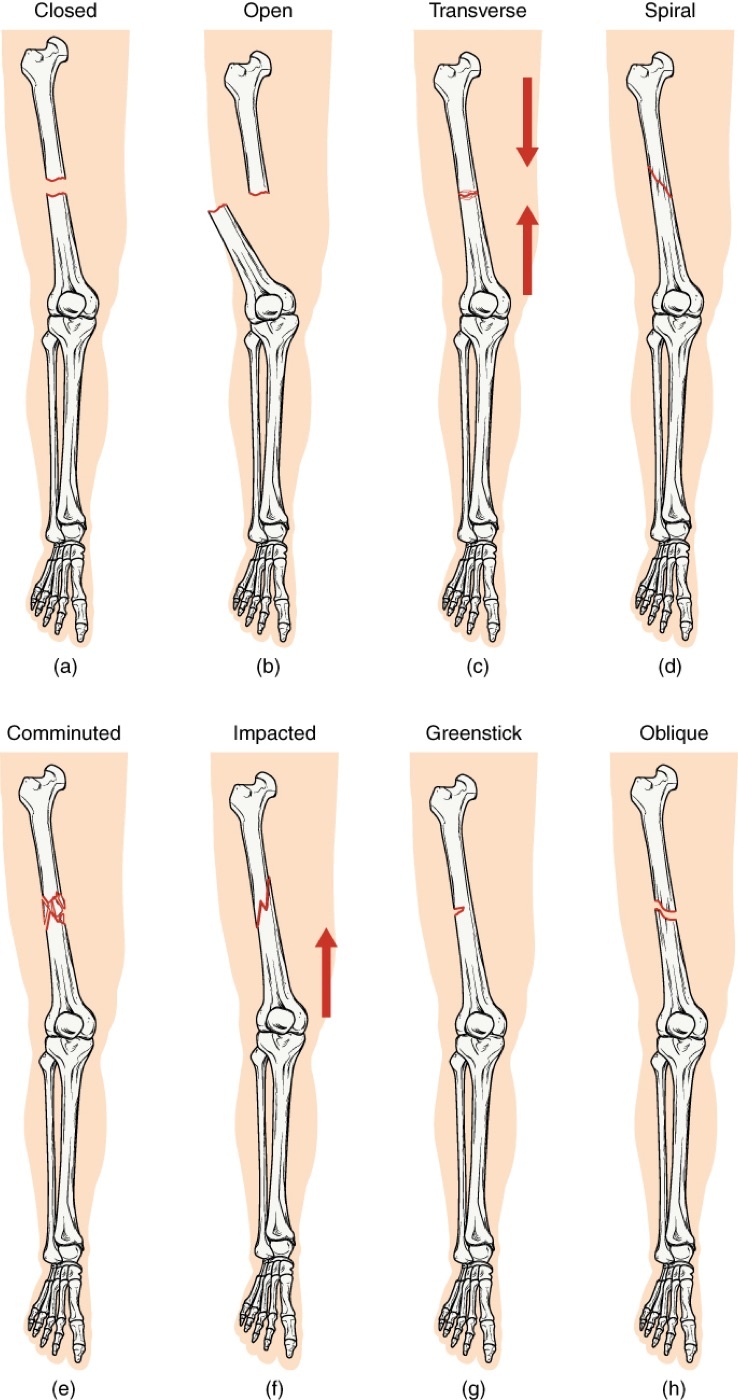
Figure 4. Fracture patterns and the corresponding loading: closed/open, transverse, spiral, comminuted, impacted, greenstick and oblique. Source: OpenStax College, Anatomy & Physiology, via Wikimedia Commons, CC BY 4.0.
Figure 4. Fracture patterns and the corresponding loading: closed/open, transverse, spiral, comminuted, impacted, greenstick and oblique. Source: OpenStax College, Anatomy & Physiology, via Wikimedia Commons, CC BY 4.0.
Reading the radiograph backwards to the injury:
- Tension → transverse fracture (perpendicular to the long axis), often an avulsion at a tendon or ligament insertion (olecranon, patella, fifth-metatarsal base, medial malleolus). Lower energy.[16]
- Compression → oblique (~45°) fracture along the plane of maximum shear, often failing first in the weaker metaphyseal cancellous bone. The vertebral burst fracture is the axial-compression archetype.[17]
- Bending → a transverse fracture with a butterfly (wedge) fragment: tension on the convex side starts a transverse line, while compression on the concave side produces oblique shear lines that meet to free a wedge.[18]
- Torsion → spiral fracture, the crack winding along planes of maximal tensile stress, usually relatively low energy.[19]
- Combined and high-energy loading → comminuted (multifragmentary) fractures. The degree of comminution is directly proportional to the absorbed energy, and high loading rates branch the fracture into many planes.[20]
- In children, the elastic periosteum and softer bone give the incomplete patterns: greenstick, torus (buckle) and plastic deformation.[21]
Energy of injury is the unifying concept. The kinetic energy delivered (½mv², so velocity dominates) determines comminution and, critically, the soft-tissue damage: high-energy injuries are comminuted, contaminated and slow to heal.[22] A related concept is the stress riser, a defect or abrupt change in stiffness that locally concentrates stress. A cortical defect under 10% of the bone diameter barely weakens it, but a defect growing from 10% to 20% drops torsional strength by about a third, and a 50% cortical defect reduces bending strength ~65% and torsional strength ~85%.[23]
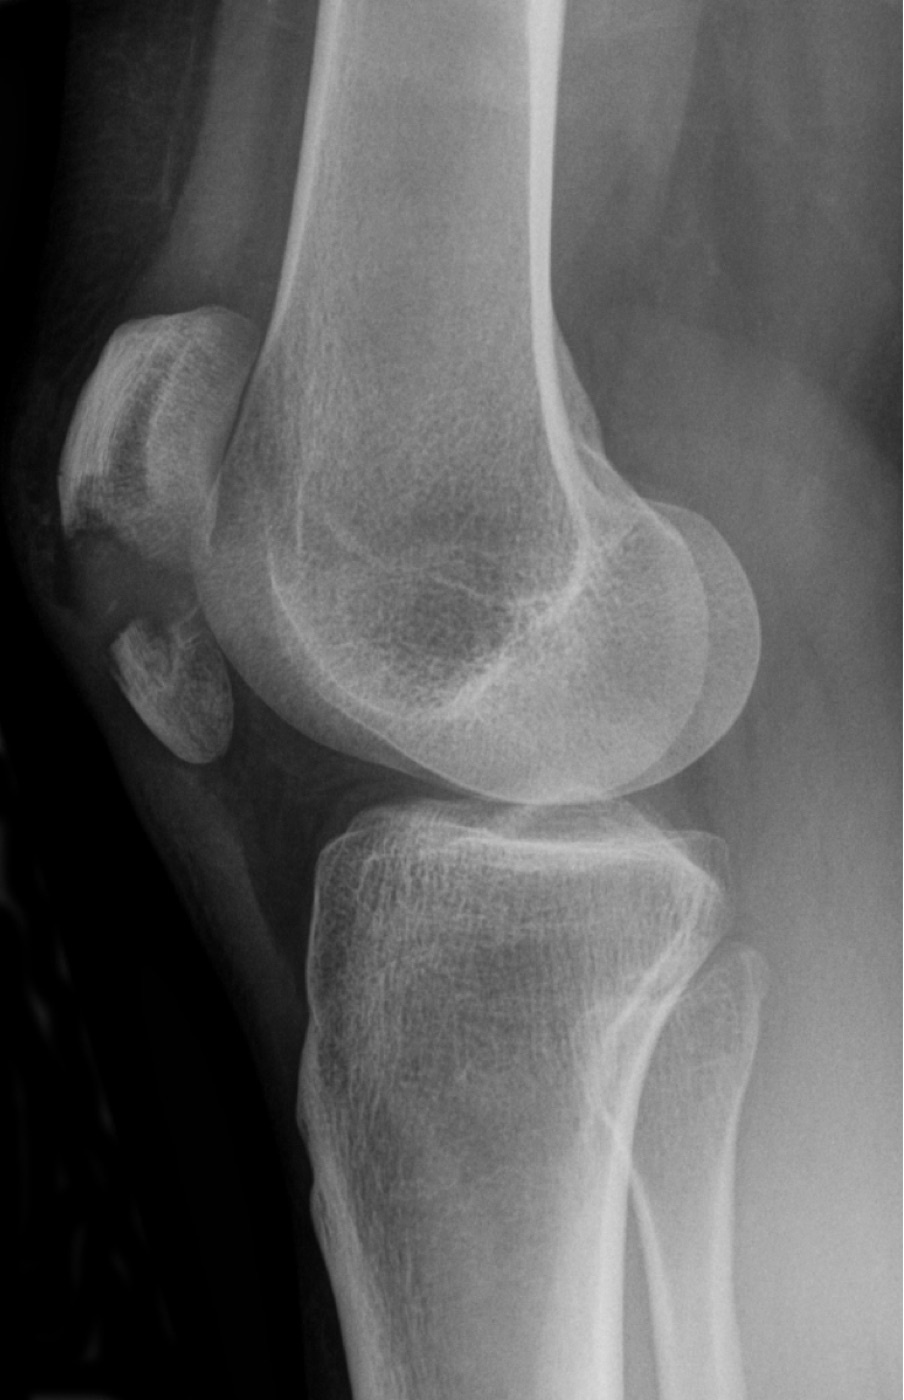
Figure 5. Transverse fracture of the patella (tension/avulsion mechanism). Source: Hellerhoff, via Wikimedia Commons, CC BY-SA 3.0.
Figure 5. Transverse fracture of the patella (tension/avulsion mechanism). Source: Hellerhoff, via Wikimedia Commons, CC BY-SA 3.0.
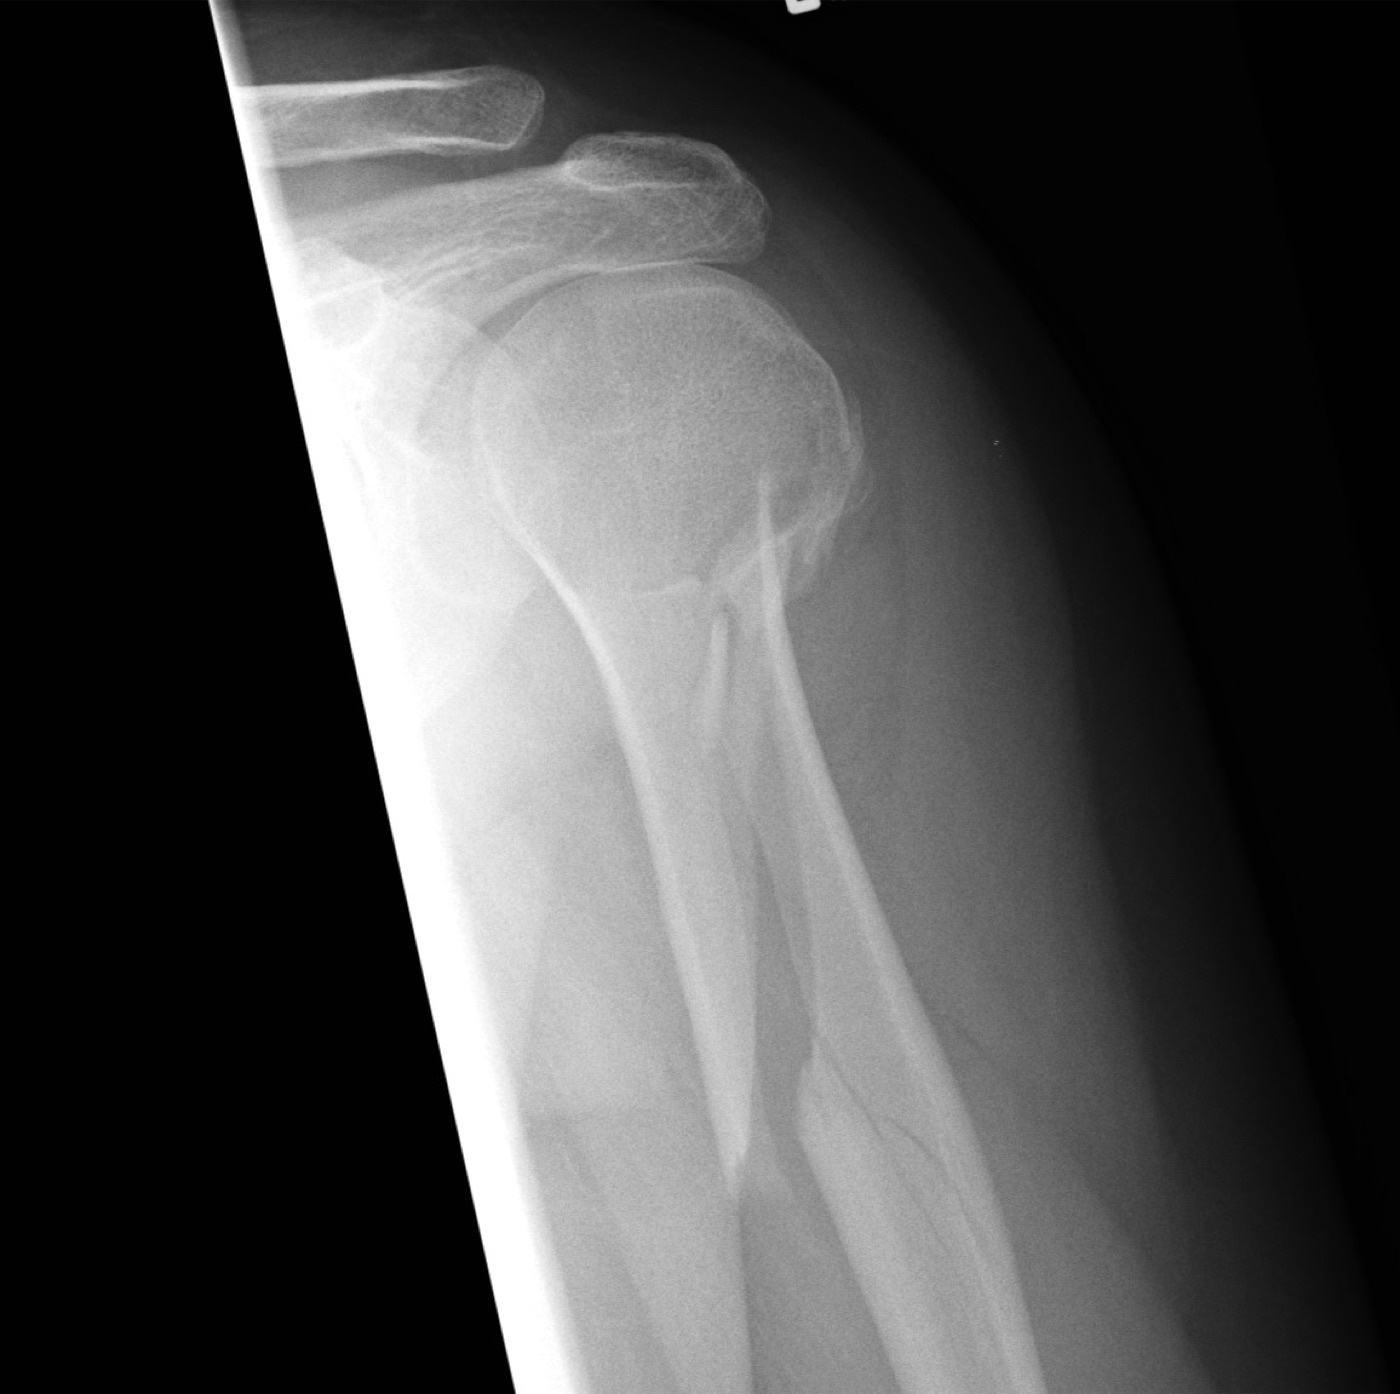
Figure 6. Spiral fracture of the humeral shaft (torsional mechanism). Source: RSJThompson, via Wikimedia Commons, CC BY-SA 3.0.
Figure 6. Spiral fracture of the humeral shaft (torsional mechanism). Source: RSJThompson, via Wikimedia Commons, CC BY-SA 3.0.
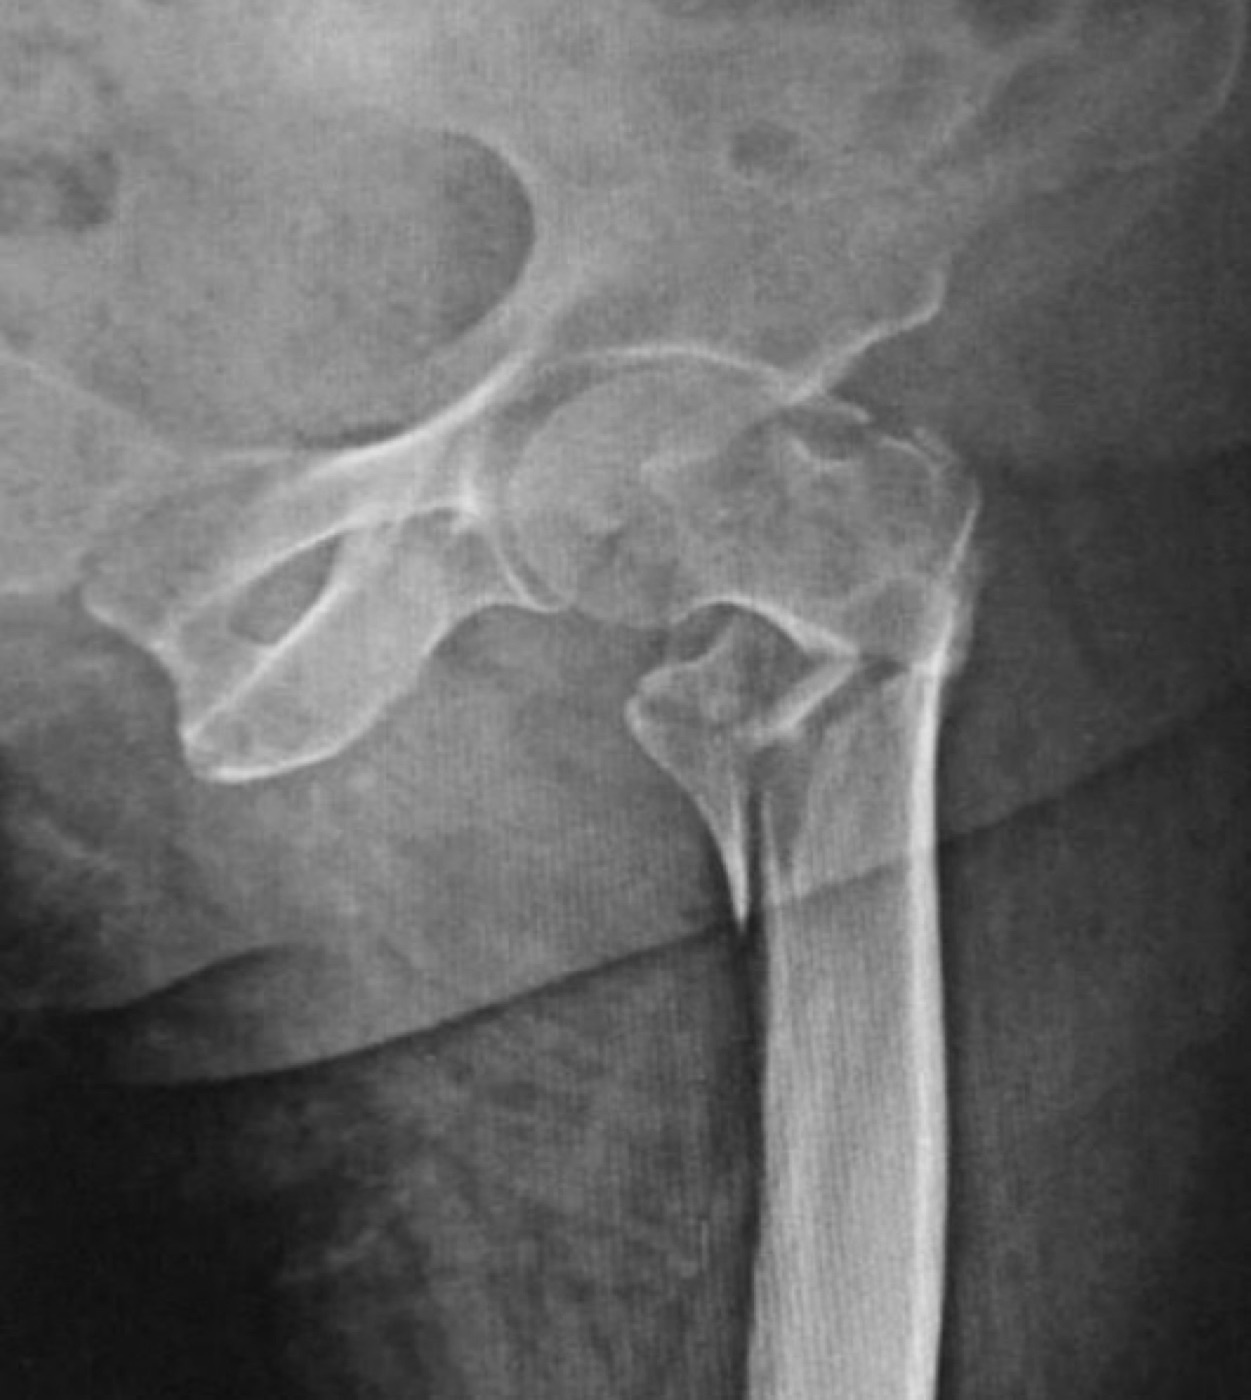
Figure 7. Comminuted (multifragmentary) trochanteric fracture of the proximal femur (high energy). Source: Memon, Patel & Juva, via Wikimedia Commons, CC BY 4.0.
Figure 7. Comminuted (multifragmentary) trochanteric fracture of the proximal femur (high energy). Source: Memon, Patel & Juva, via Wikimedia Commons, CC BY 4.0.
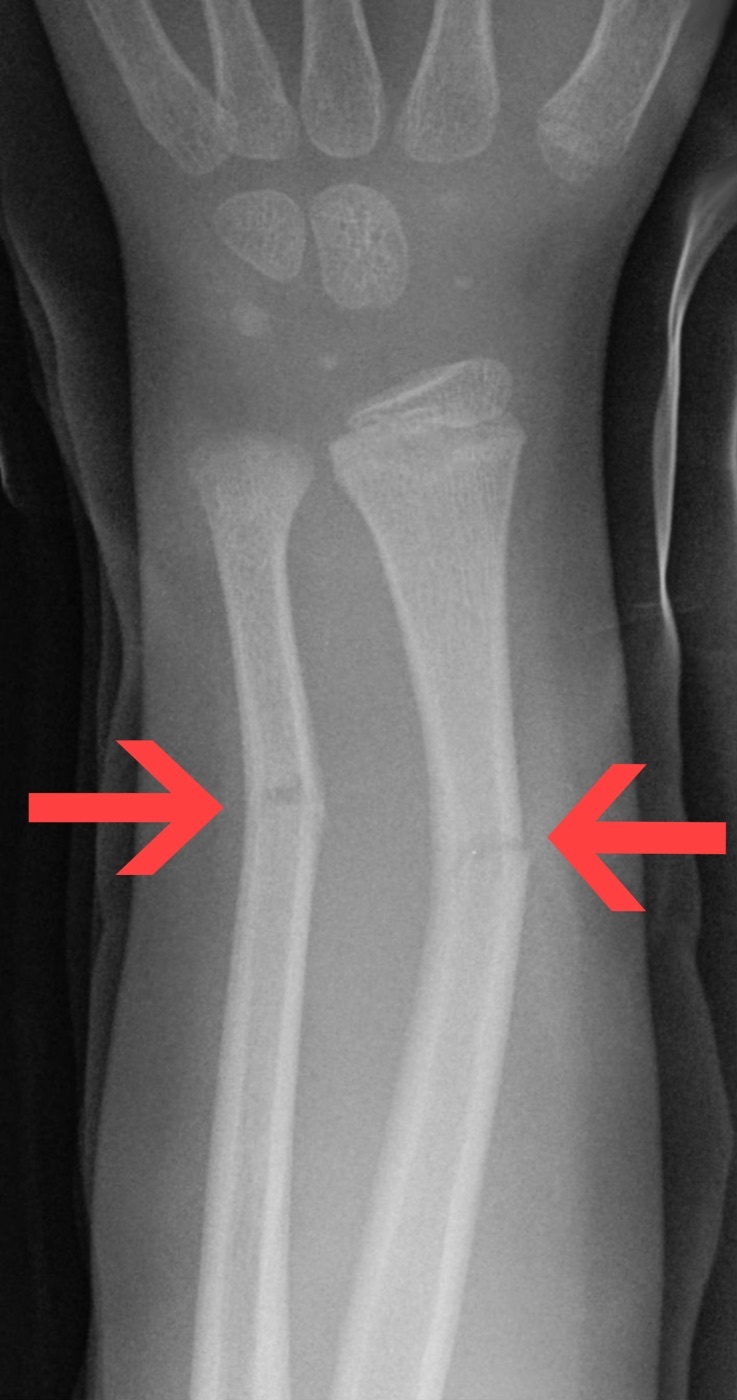
Figure 8. Greenstick fractures of the paediatric radius and ulna (incomplete fracture). Source: Hellerhoff, via Wikimedia Commons, CC BY-SA 3.0.
Figure 8. Greenstick fractures of the paediatric radius and ulna (incomplete fracture). Source: Hellerhoff, via Wikimedia Commons, CC BY-SA 3.0.
Part IV - Open versus Closed Fractures and the Soft-Tissue Envelope
A fracture is open (compound) when the soft-tissue envelope is breached so that the fracture communicates with the environment, bringing contamination and a higher risk of infection, nonunion and amputation; otherwise it is closed.[24] The state of the soft tissues matters as much as the bony injury, particularly where cover is thin, at the proximal and distal tibia, and it often dictates the timing of surgery.[25]
Open fractures are graded by the Gustilo-Anderson classification (originally for the tibia): type I, a clean wound under 1 cm; type II, 1-10 cm with moderate soft-tissue damage; type III, a wound over 10 cm or any high-energy injury, subdivided into IIIA (adequate soft-tissue cover), IIIB (extensive soft-tissue loss with periosteal stripping, needing flap coverage) and IIIC (an arterial injury requiring repair).[26] The system has only moderate reliability (≈60% agreement), and the final grade often depends on the surgeon’s ability to close the wound. For that reason the newer OTA Open Fracture Classification instead grades five mutually exclusive components: skin, muscle, arterial, bone loss and contamination.[27]
Closed soft-tissue injury is graded by the Oestern-Tscherne classification, grades 0-3, from minimal injury to extensive crushing with possible compartment syndrome.[28]
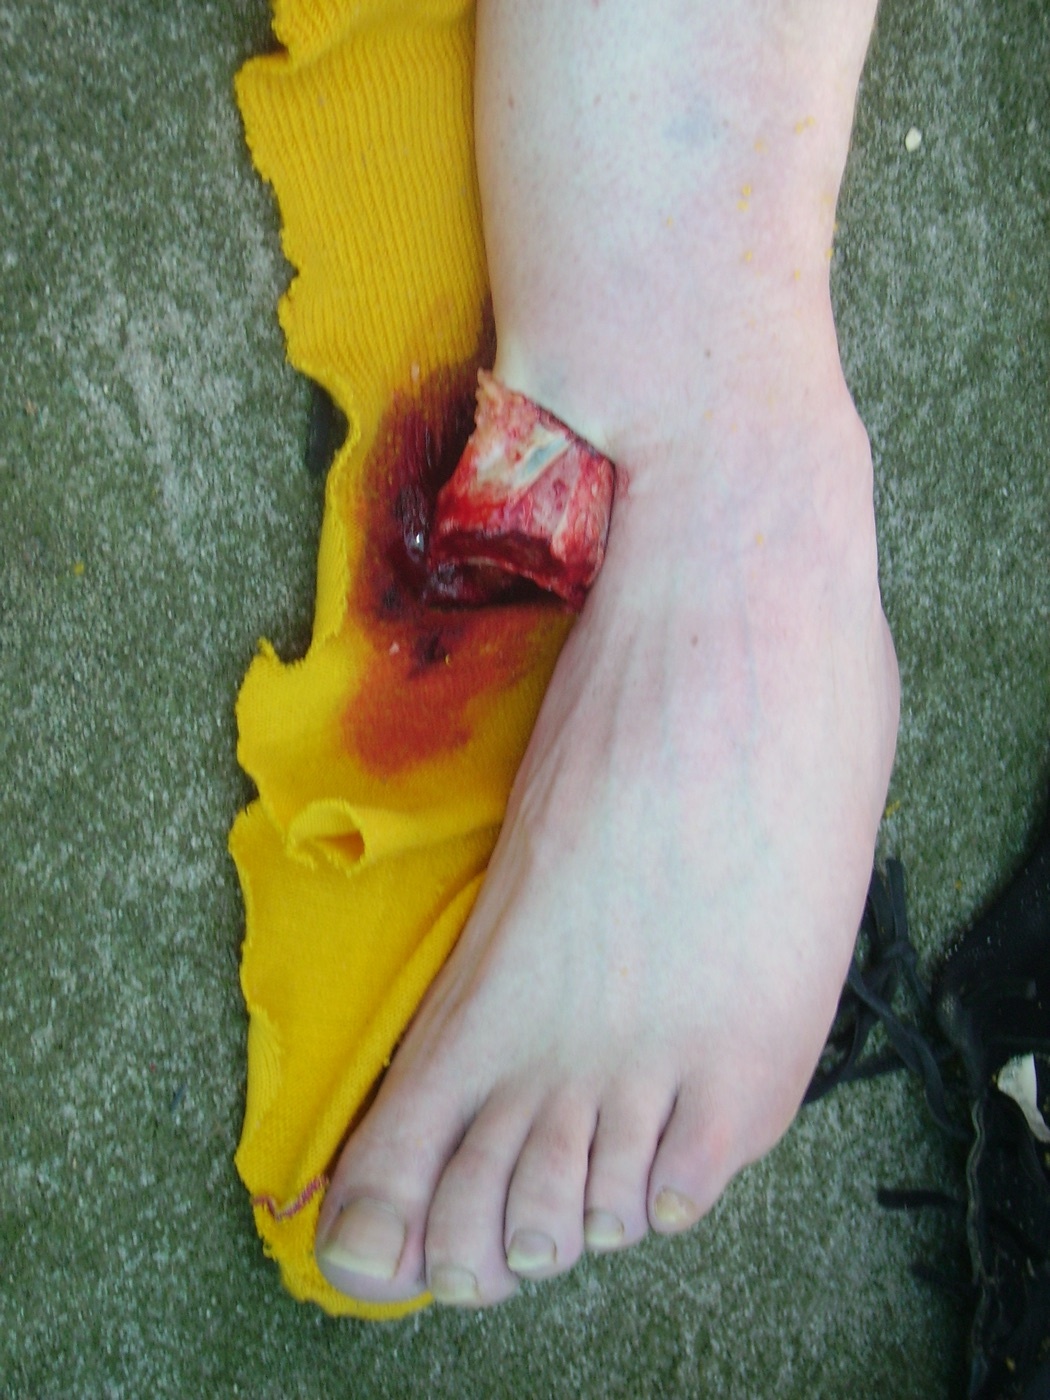
Figure 9. Open (compound) fracture-dislocation of the ankle: bone protruding through the disrupted soft-tissue envelope. Source: Xy01, via Wikimedia Commons, CC BY-SA 2.0 DE.
Figure 9. Open (compound) fracture-dislocation of the ankle: bone protruding through the disrupted soft-tissue envelope. Source: Xy01, via Wikimedia Commons, CC BY-SA 2.0 DE.
Part V - Fracture Classification
Why and how we classify
A classification organises knowledge, and to be worth using it must guide treatment and predict prognosis as well as enable communication and research.[29] Its quality is judged by reliability (observer agreement, measured by the kappa statistic, with Landis & Koch grading 0.61-0.80 as substantial), accuracy against the true injury, and content validity. Many widely used systems sit only in the fair-to-moderate range, partly because they force a continuous spectrum of injury severity into discrete categories.[30]
Before any eponymous system, every fracture is described: which bone and segment (proximal/diaphyseal/distal, intra- versus extra-articular), the pattern (transverse, oblique, spiral, wedge/butterfly, comminuted/segmental, avulsion, impacted), and the displacement (translation, angulation, rotation, shortening).[31]
The AO/OTA alphanumeric system
The comprehensive system, originated by Maurice Müller and maintained jointly by the AO Foundation and the Orthopaedic Trauma Association (current revision 2018), codes every fracture in steps:[32]
- Bone (1 = humerus, 2 = radius/ulna, 3 = femur, 4 = tibia/fibula, and so on) and segment (1 = proximal, 2 = diaphysis, 3 = distal; with a 4th malleolar segment for the ankle).
- Type A/B/C of increasing severity. For the diaphysis: A = simple, B = wedge, C = multifragmentary. For the articular (end) segments: A = extra-articular, B = partial articular, C = complete articular.
- Further group and subgroup qualifiers (for the simple diaphysis: spiral A1, oblique ≥30° A2, transverse <30° A3) plus universal modifiers.
A displaced articular fracture is always coded to the end segment, because the joint injury dominates treatment and prognosis.[33]
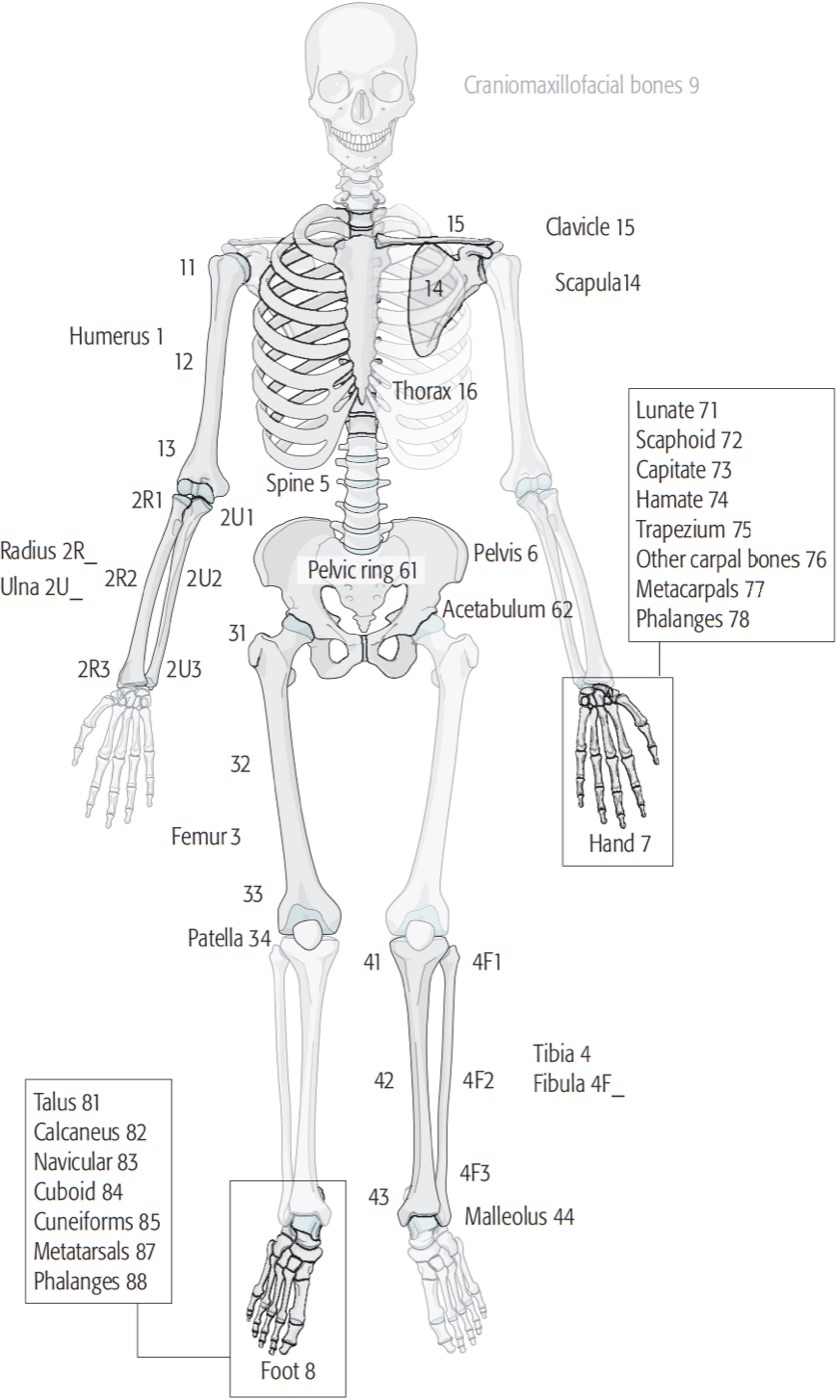
Figure 10. The AO/OTA bone-numbering scheme (1 humerus, 2 radius/ulna, 3 femur, 4 tibia/fibula…), the first element of the alphanumeric fracture code. Source: Kellam et al. (AO/OTA), via Wikimedia Commons, CC BY-SA 4.0.
Figure 10. The AO/OTA bone-numbering scheme (1 humerus, 2 radius/ulna, 3 femur, 4 tibia/fibula…), the first element of the alphanumeric fracture code. Source: Kellam et al. (AO/OTA), via Wikimedia Commons, CC BY-SA 4.0.
Physeal injuries - the Salter-Harris classification
In children, fractures involving the growth plate are graded by the Salter-Harris classification (mnemonic “SALTR”): type I, separation through the physis (Slipped); type II, through the physis with a metaphyseal fragment (Above, the commonest); type III, through the physis and epiphysis into the joint (Lower); type IV, across metaphysis, physis and epiphysis (Through); and type V, a crush of the physis (Ruined), which carries the worst prognosis for growth arrest.[34]
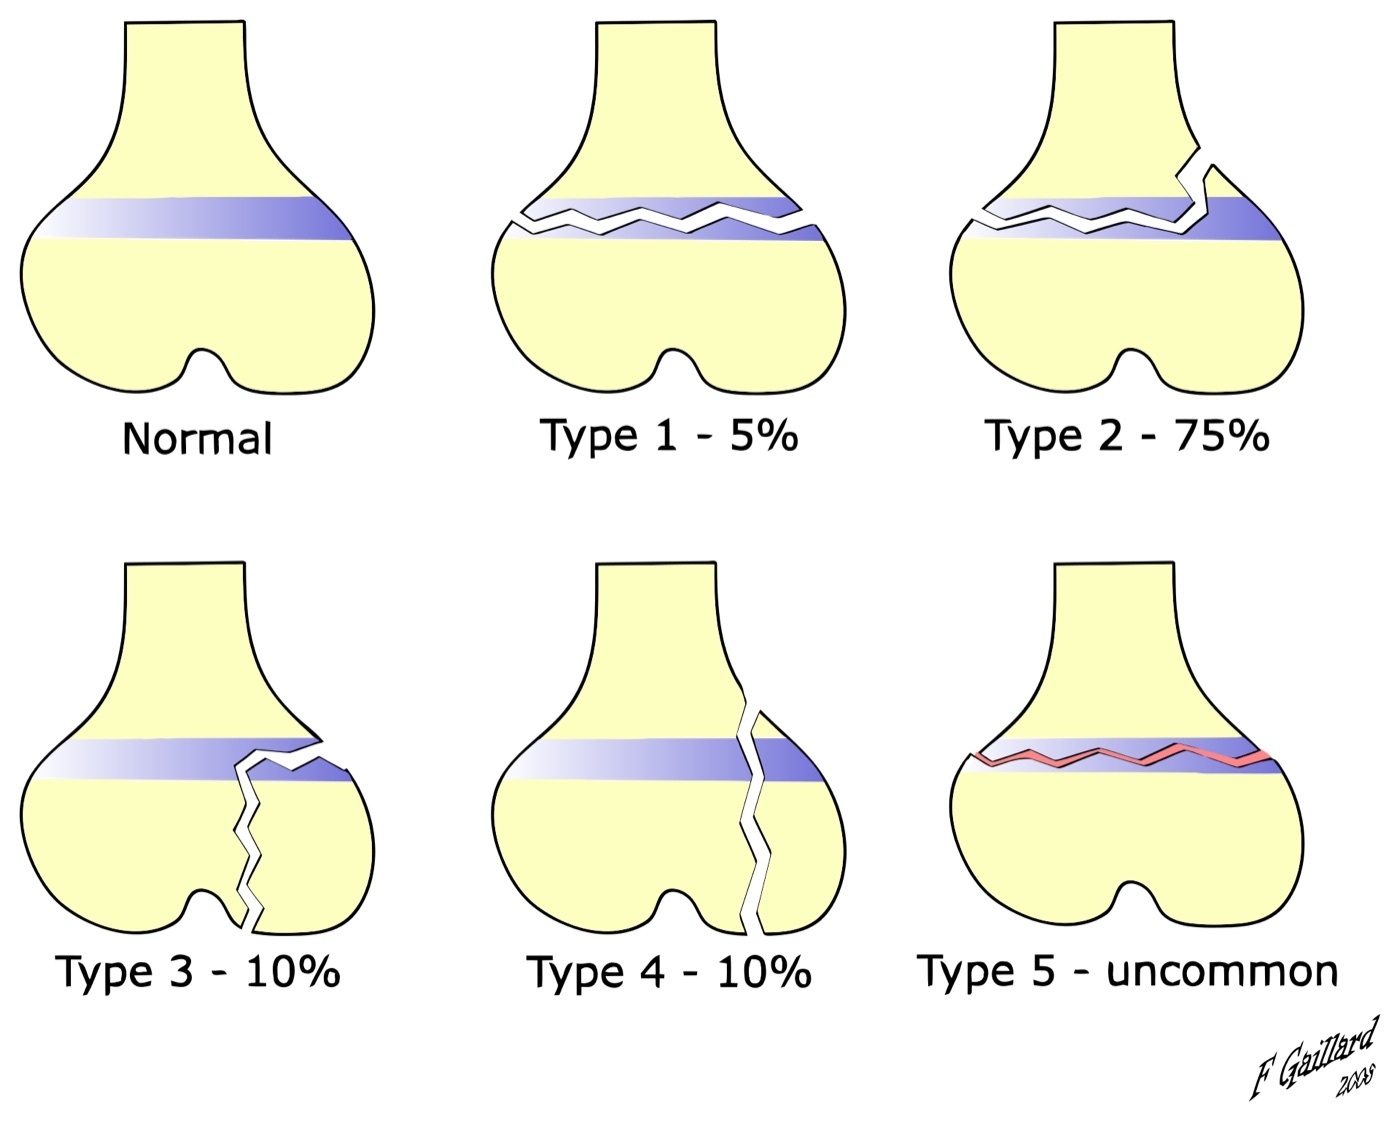
Figure 11. Salter-Harris classification of physeal injuries, types I-V. Source: Frank Gaillard (derivative by Zerodamage), via Wikimedia Commons, CC BY-SA 3.0.
Figure 11. Salter-Harris classification of physeal injuries, types I-V. Source: Frank Gaillard (derivative by Zerodamage), via Wikimedia Commons, CC BY-SA 3.0.
Region-specific eponymous systems
For individual injuries, named classifications carry the treatment logic. Among many: Neer (proximal humerus), Garden and Pauwels (femoral neck), Schatzker (tibial plateau), Danis-Weber and Lauge-Hansen (ankle), Mason (radial head), Sanders and Essex-Lopresti (calcaneus), and Hawkins (talar neck).[35]
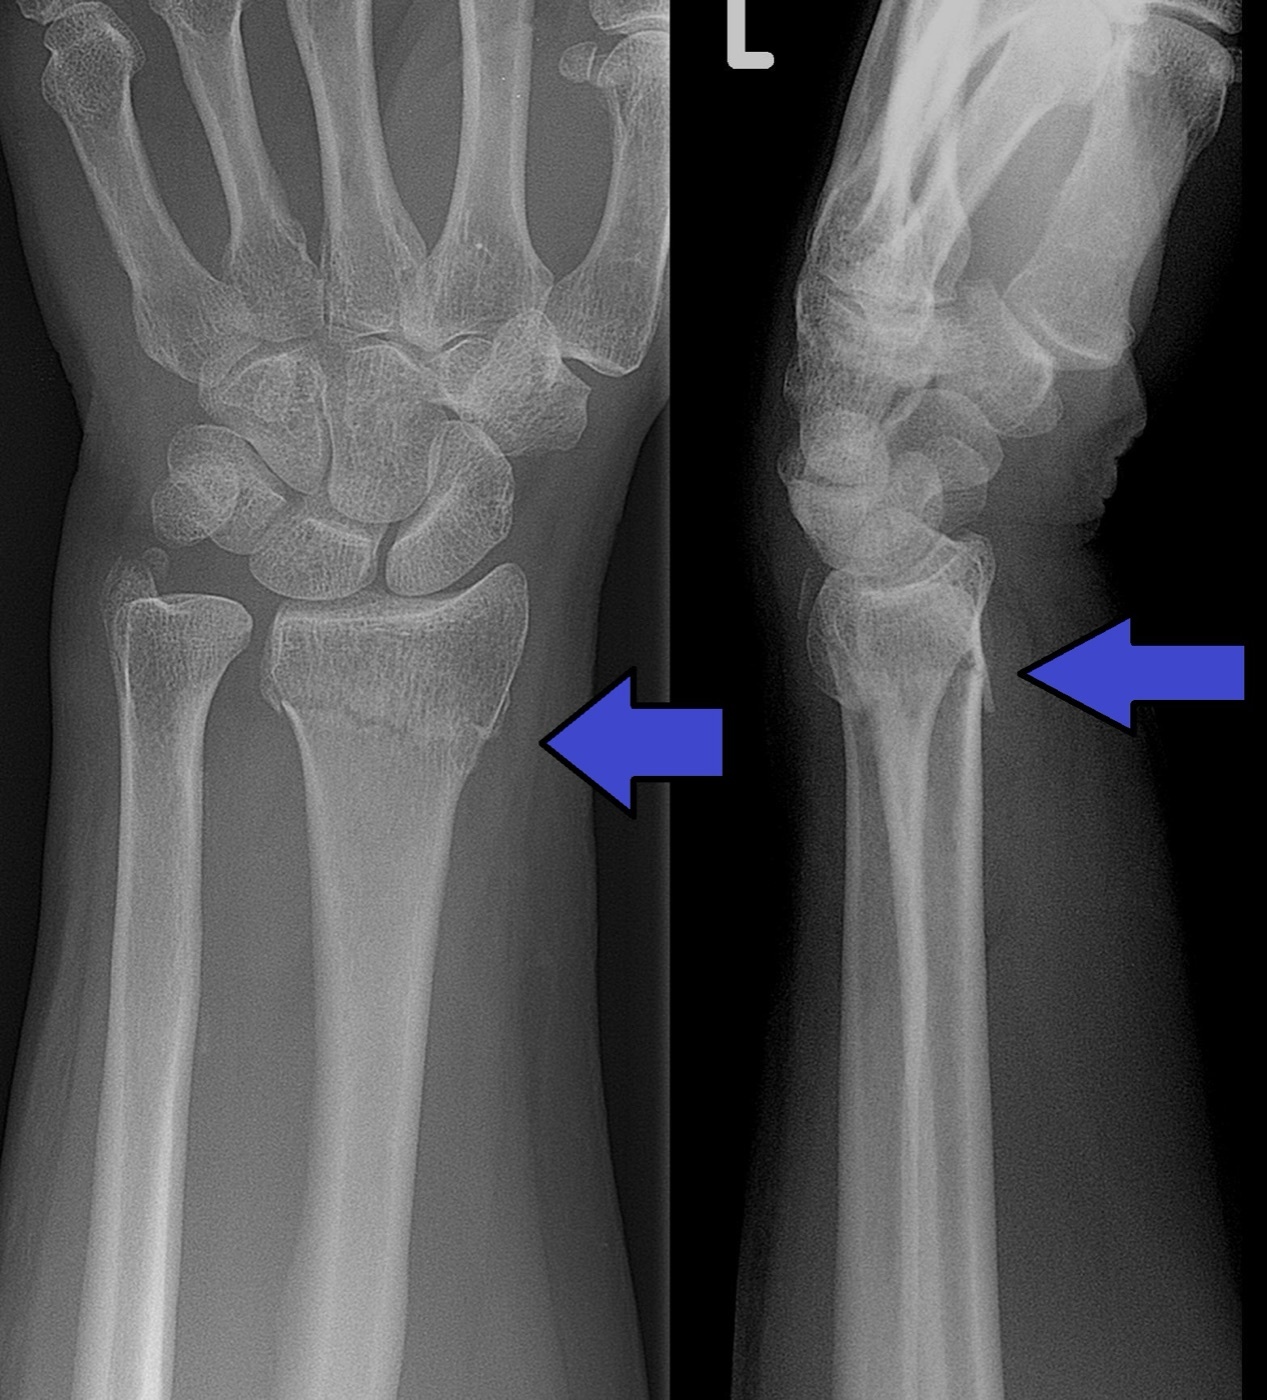
Figure 12. A Colles fracture - an extra-articular distal-radius metaphyseal fracture, the archetypal eponymous fracture. Source: Lucien Monfils, via Wikimedia Commons, CC BY-SA 3.0.
Figure 12. A Colles fracture - an extra-articular distal-radius metaphyseal fracture, the archetypal eponymous fracture. Source: Lucien Monfils, via Wikimedia Commons, CC BY-SA 3.0.
References
-
Skeletal Trauma p. 138.
-
Skeletal Trauma p. 138. Osteogenesis imperfecta, a defect of type I collagen, demonstrates the point: bone becomes brittle and fracture-prone.
-
Skeletal Trauma pp. 138-139; AO p. 33.
-
Skeletal Trauma pp. 139-140; Rockwood & Green p. 30. Because trabecular stiffness/strength fall with roughly the cube of density, a small loss of bone density (osteoporosis) markedly weakens cancellous bone.
-
Rockwood & Green pp. 26-27; Skeletal Trauma pp. 131-134.
-
Rockwood & Green p. 26.
-
Rockwood & Green p. 27.
-
Skeletal Trauma p. 134.
-
Rockwood & Green p. 27; AO p. 30.
-
Rockwood & Green pp. 29-30; Skeletal Trauma pp. 142-143.
-
Rockwood & Green p. 29; the strain-rate effect is real but modest.
-
Rockwood & Green p. 28; Skeletal Trauma p. 139. Femoral cortical ultimate strength: ~205 MPa compression, ~135 MPa tension, ~71 MPa shear.
-
Rockwood & Green p. 28; Skeletal Trauma pp. 134, 146.
-
Skeletal Trauma pp. 135-139; the principle is described though the eponym “Wolff’s law” is standard teaching.
-
Rockwood & Green p. 34. Because bone is anisotropic, tensile failure needs the least energy and compressive failure the most - patella in tension ~3 J, tibia in torsion ~10 J, vertebral body in compression ~100 J.
-
Rockwood & Green p. 34.
-
Rockwood & Green p. 35; Skeletal Trauma p. 144.
-
Rockwood & Green p. 36; Skeletal Trauma p. 144. Higher energy than a simple transverse or oblique fracture.
-
Rockwood & Green p. 36; Skeletal Trauma pp. 143-144.
-
Rockwood & Green p. 37; Skeletal Trauma p. 145.
-
AO p. 35 names greenstick among inherently stable fractures; the paediatric incomplete patterns are standard teaching not elaborated in these adult sources.
-
Rockwood & Green p. 37; the ½mv² relationship is standard physics, the energy-comminution correlation is from Rockwood. Rapid separation of fracture surfaces also causes cavitation and soft-tissue implosion (AO p. 30).
-
Rockwood & Green p. 44; Skeletal Trauma p. 147. A 1 mm loss of cortical thickness halves screw-fixation strength.
-
Rockwood & Green p. 227.
-
Rockwood & Green p. 230.
-
Rockwood & Green pp. 227-228. Infection rates rise with grade - historically up to ~44% in type III.
-
Rockwood & Green pp. 228-229 (Brumback & Jones).
-
Rockwood & Green p. 230.
-
Rockwood & Green pp. 206-210 (Müller’s dictum); AO p. 59.
-
Rockwood & Green pp. 210-212; AO pp. 68-69.
-
Rockwood & Green pp. 215-220; AO pp. 61, 69.
-
Rockwood & Green pp. 213-221; AO pp. 59-68.
-
AO p. 66.
-
Standard paediatric teaching; the Salter-Harris system is not contained in these adult-fracture sources and is supplied here as established knowledge.
-
Rockwood & Green pp. 208-226. Each is detailed in the relevant regional topic.
-
Skeletal Trauma p. 138.
-
Rockwood & Green pp. 26-27.
-
Rockwood & Green pp. 28-29; Skeletal Trauma p. 139.
-
Rockwood & Green p. 28; Skeletal Trauma p. 146.
-
Rockwood & Green pp. 34-37.
-
Rockwood & Green p. 37.
-
Rockwood & Green p. 44; Skeletal Trauma p. 147.
-
Rockwood & Green pp. 227-229.
-
Rockwood & Green pp. 215-221; AO pp. 61-68.
-
Standard paediatric teaching.
-
Rockwood & Green pp. 206-212.